
Dating is a numbers game on different levels. Who you can romantically connect with depends on the number of people you find attractive around you, how many magnetic qualities you can display in order to be interesting to those people, and the number of other choices for a partner those that you fancy have.
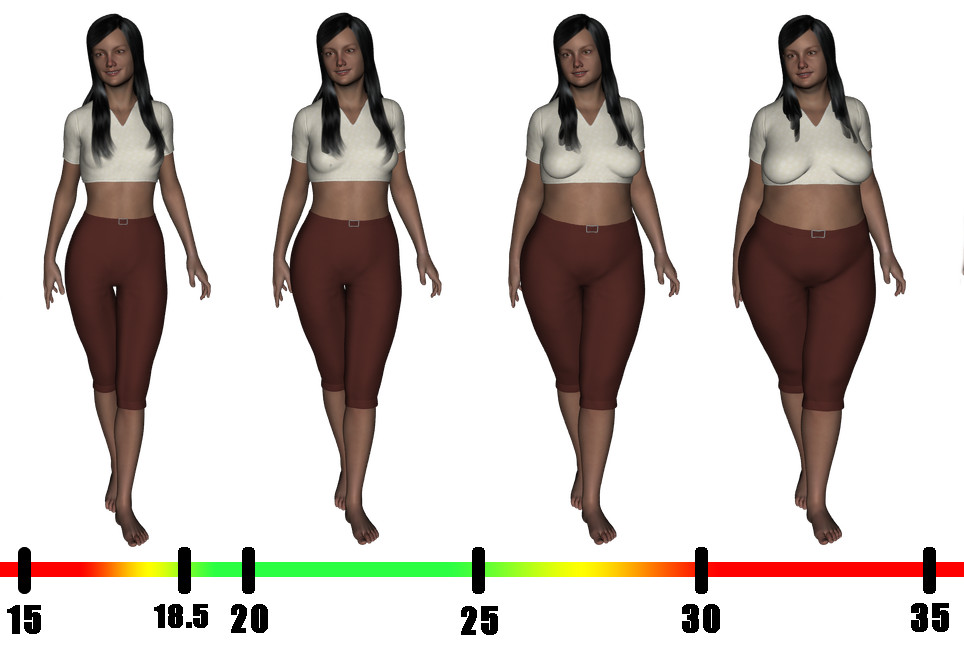
While the obesity levels around the world is on the rise, which body types people find attractive remain mostly the same. According to studies, people in general prefer a partner with a healthy body mass index, or BMI. The BMI is calculated using the weight and height of the body. Its purpose is to indicate if people have a weight that is healthy, given their height.
I will discuss the likelihood of finding a romantic partner within a suitable weight range for you, depending on which country you live in. Actual estimates for the number of men and women within different weight ranges are presented. Special focus is given to the situation in the United States.
With the increasing obesity rates in the population, the number of people with what is typically regarded as having an attractive body weight decreases. Thus, it becomes gradually more difficult to partner with someone possessing such a quality.
Worldwide gender ratio map, adjusted for body weight
But how strong is this effect in different countries? And how has it changed over the last 25 years? The interactive map below gives answers. By combining statistics for sex ratios and body mass index for different age groups it shows the relative chances of meeting a healthy weight companion. There are a number of adjustment possibilities, to begin with I suggest you just take a quick look.
Some countries, like China and India, have a very noticeable shortage of women in the dating market. Naturally, this makes it more difficult for men to find that special one. However, if you have specific standards requiring that your loved one needs to be within the healthy body weight group defined with the BMI scale, the situation changes.
American spotlight
I will present a few gender balance numbers that are relevant for the 20 to 29 age group below, mostly pertaining to USA. The share of the desired gender with a BMI below the overweight limit of 25 will be given attention. This will give insight into how your chances are for finding a partner with a healthy weight there. I will not count out those regarded as underweight, as the statistics at hand do not specify those numbers.
The US has an estimated 95 women per 100 men in this age group. This is slightly below the world average. China, known for its unbalanced amount of men and women, has only 91 women per 100 men in their twenties.
Let us look at how these numbers change if we decide to count only those women who are not overweight, while counting all the men. We will switch genders further down. In the US 47 such women remain per 100 guys (of all BMIs), if to believe BMI estimates for 2013. It has in fact been like that for over a decade for this age group. This is two more than in Mexico, which is currently experiencing an even stronger obesity growth than the US. If to check back with China, we find there 78 women with a BMI below 25 per 100 guys.
The United States ranks as having the 20th lowest amount of women who are not overweight relative to their number of fellow countrymen. Among countries with fewer such women are Pacific, Central American and Middle Eastern countries. Also included are South Africa and Libya.
"For every year from 1990 until 2005 roughly one extra American woman per 100 men entered the overweight category in the 20 to 29 age group."
It is interesting to look at how the situation was a quarter of a century ago. If using BMI estimates for 1990, there would be 63 non-overweight women in the US per 100 males, placing the US as the 38th lowest in the aforementioned ranking. For every year until 2005 roughly one extra woman per 100 men entered the overweight category.
How are the men doing?
As promised, we will now look at this from a female perspective. The situation for men shows an even higher degree of overweight than for women. When looking at the whole population in the 20 to 29 age group, there is an estimated 104 men for every 100 women in the US.
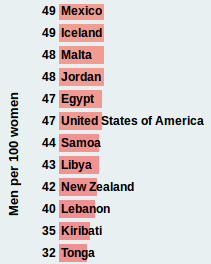
But if only counting those men with a BMI of under 25, the number is down to 47 men per 100 women. This is 7th lowest in the world, ahead of Tonga, Kiribati, Lebanon, New Zealand, Libya and Samoa.
There is a tendency that once a few extra pounds come on, they lay the foundation for more to come. This is no secret, and it means that the average BMI in the population increases as we get older. In the 30 to 34 age group there are 38 women with a BMI below 25 for every 100 guys.
From a female perspective, chances for finding a healthy weighing male are slimmer still. For a woman looking to meet a guy not considered overweight or obese, she will find that 29 out of 100 men fall into this category in the US in the 30 to 34 age group.
I started off saying that most people look for somebody in the healthy weight range. It should be mentioned that research has shown that the most happy couples are those where the woman has a lower BMI than the man. Even if they are both overweight, this was an important factor for longlasting happiness. So, an overweight woman may use the map to look for countries where men are more overweight than herself. That will be where she will have the most options.
These numbers were derived using the Singles Atlas, which in turn relies on population estimates from the United Nations and BMI estimates from Institute for Health Metrics and Evaluation (IMHE) for the numbers given in this article. The BMI database is made available under the Open Data Commons Attribution License.
There's more to see
Other fascinating stuff relevant for single people can be discovered by using the Singles Atlas. We have local data for many countries. You can for instance see which ZIP-codes have an abundance of unmarried men compared to unmarried women in your city surroundings, if you live in the US. Similar local data exists for England. Maybe a man's height is of importance to you? With this starting point it's quick to see where your chances are the tallest.
Or perhaps you're a man and your search for romance spans the oceans. Check out this European view, showing that Romania has the highest proportion of slender young women in Europe. Or why not sort out those countries that have the most unmarried non-overweight women compared to men, ages 25 to 34, while filtering out a bunch of countries with high living costs, and a low level of democracy? You may have other demands, so prepare yourself to adjust those sliders to your own choosing in this map.